

Are you using Looker as your business intelligence tool and seeking a streamlined approach for period-over-period comparison? If you’re aiming to minimize time spent on coding, we offer a solution tailored to your needs. With our methodology, integrating period-over-period comparison into your Looker project will take less than 10 minutes.
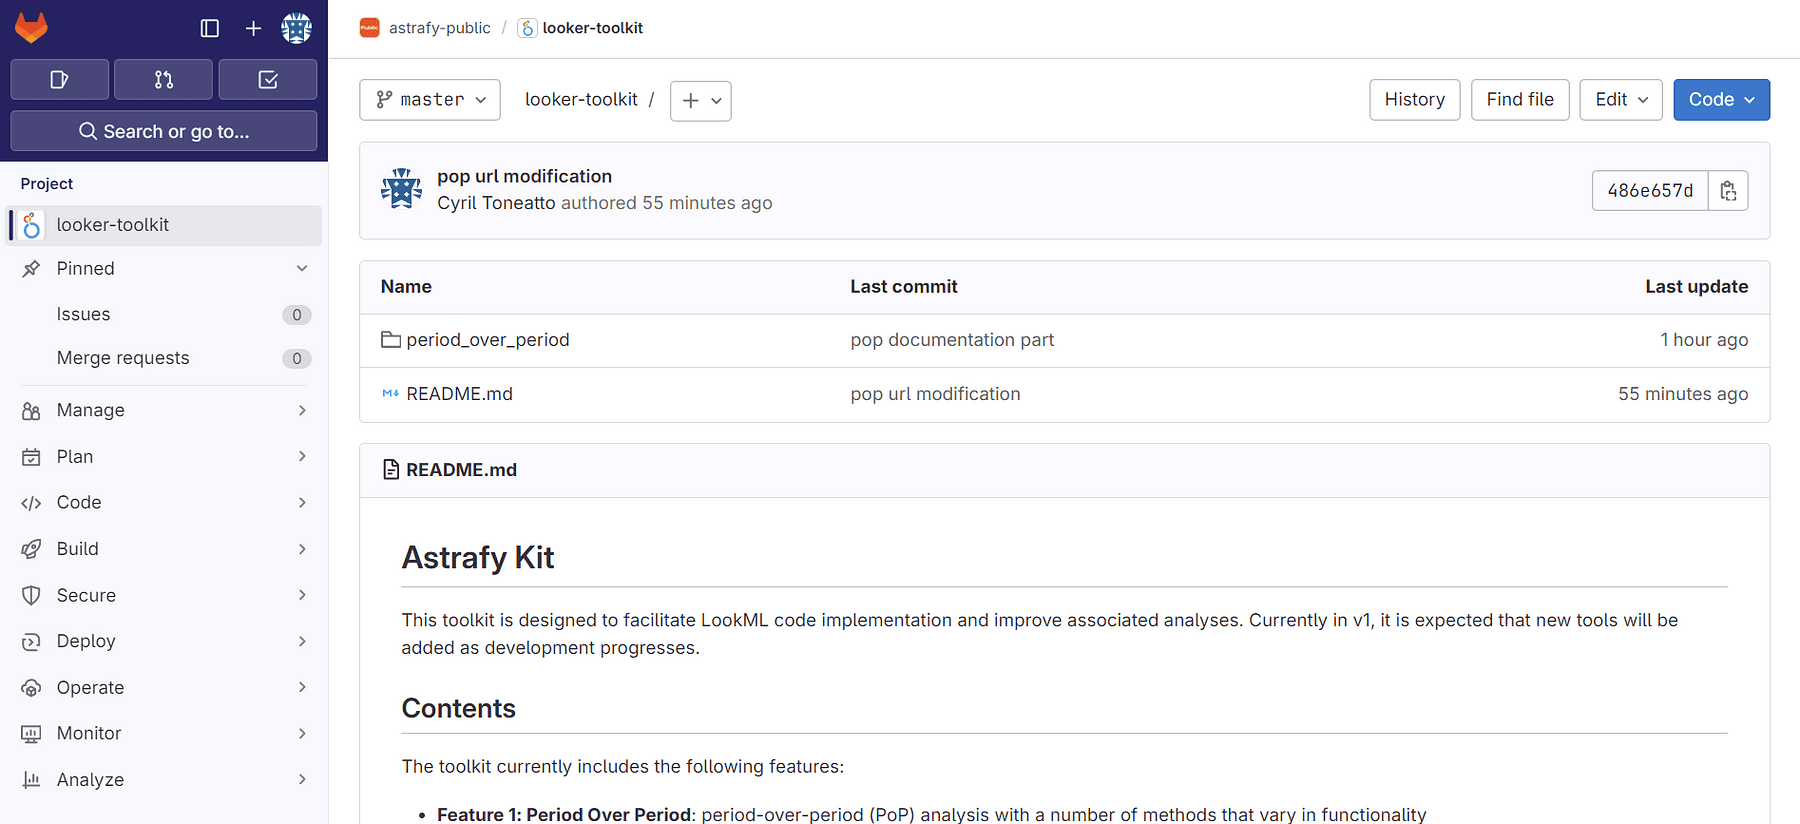
We’ve developed a comprehensive toolkit available on GitLab, which can be seamlessly integrated into all your projects. This toolkit includes various methods for period-over-period analysis, each implemented following the Methods for Period Over Period (PoP) Analysis in Looker documentation. This ensures flexibility, allowing you to choose the method that best suits your requirements.
Our approach eliminates the need for you to implement period-over-period comparison from scratch. Simply follow these straightforward steps.
A Step-by-Step Guide
Let’s consider a scenario where you have a Google Analytics sessions view file in Looker with a “date” field and wish to use method 6 (comparison between two arbitrary periods) for period-over-period comparison.
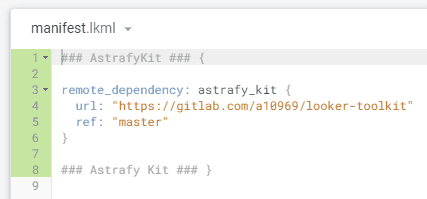
Connect to remote repository
Copy and paste the provided code snippet into your project manifest.
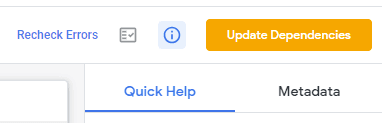
Update dependencies
Click on “Update Dependencies” to import the remote project.
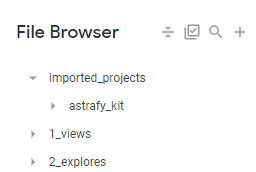
Imported Folder
A new folder named “imported_projects” will automatically appear. It will detect automatically new versions of the remote project.
Include
Include the relevant file from the imported project into your view file using the filename and project name as shown below.
Extend
Enhance your view by adding the “extends” to employ period-over-period analysis:
Date Dimension
Define your date dimension for period-over-period analysis in your view file.
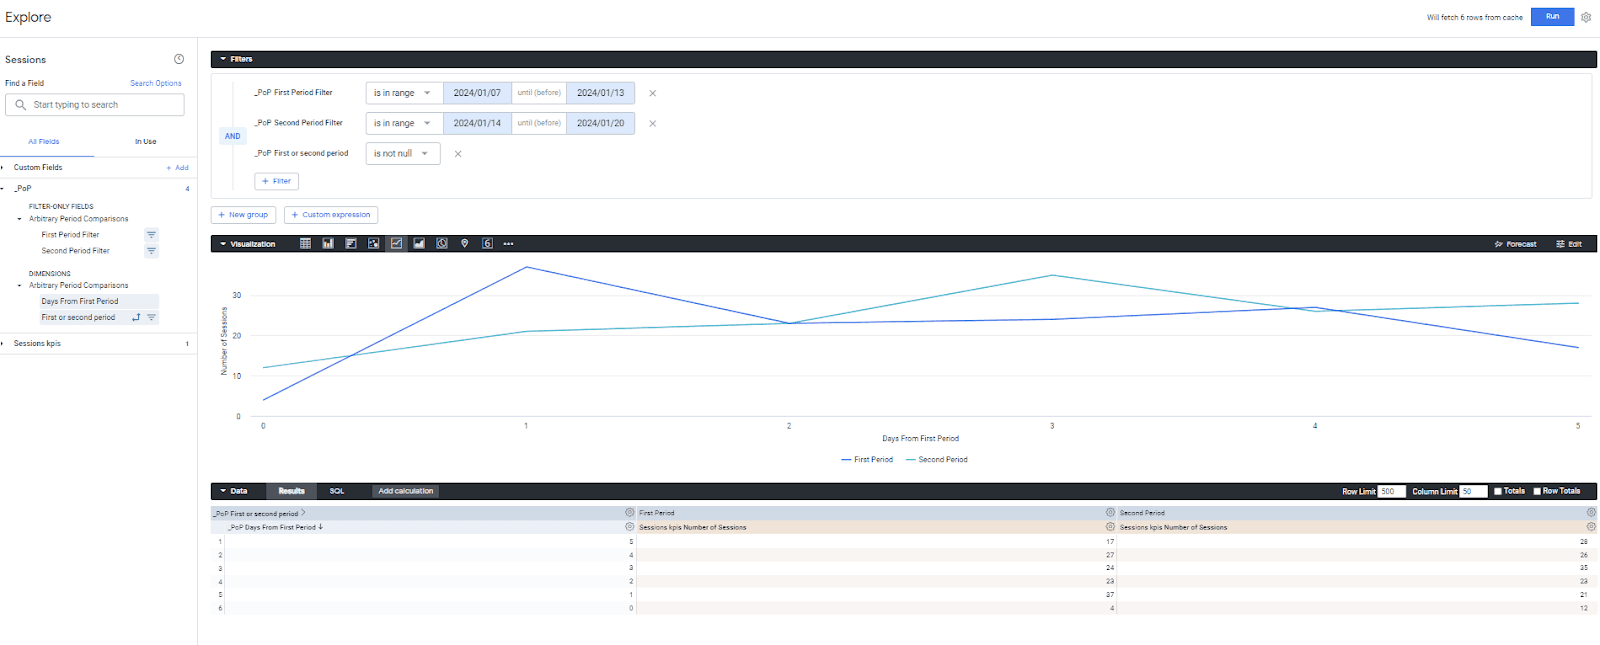
Compare your data
That’s it! Now you can effortlessly create visualisations leveraging the remote project where period-over-period comparison has been implemented.
Conclusion
This methodology is used here for the period-over-period feature, but the “imported_projects” allows for flexible reuse of model files, view files, and more across multiple projects. Consider the scenario where you wish to use some views across multiple projects; rather than resorting to copy-pasting and the subsequent maintenance overhead, you could opt for this streamlined approach where you maintain your views in a single location.
Thank you
If you enjoyed reading this article, stay tuned as we regularly publish articles on Looker and how to get the most value of this tool. Follow Astrafy on LinkedIn to be notified for the next article ;).
If you are looking for support with your Looker implementation, advice on Modern Data Stack or Google Cloud solutions, feel free to reach out to us at sales@astrafy.io.


