Introduction
Logs in Google Cloud have saved me a ton of hours and headaches. It helped me debug on numerous occasions failures that I would not have been able otherwise. One time, a colleague spent several days trying to run a BigQuery workload using a service account. He had all the right permissions set up, and still, it didn’t work. After some minutes of checking the logs, we discovered that he was using the gcloud command authenticated as another service account.
For some reason, there was no way to change the configuration, and he solved the problem by reinstalling the gcloud CLI. We may have reinstalled the CLI due to desperation if we didn’t check the logs, but we would have never discovered what was causing the issue.
In a nutshell, Cloud Logging provides a real-time log-management system with storage, search, analysis, and monitoring support in Google Cloud. It is a fantastic service, but understanding it becomes crucial as your Google Cloud usage increases. You don’t want to wake up one day knowing that 15% of your Cloud budget was consumed by Cloud Logging.
Different types of logs
Later on, we will look at how Google Cloud stores your logs. But first, let’s start explaining what it stores.
There are five types of logs. These are platform logs, component logs, security logs, user-written logs, and multi-cloud logs.
Platform logs
This type of log is written by Google Cloud services. These logs can help you debug and troubleshoot issues, and help you better understand the Google Cloud services you’re using. For example, VPC Flow Logs record a sample of network flows sent from and received by VM instances.
Component logs
Component logs are similar to platform logs, but they are generated by Google-provided software components that run on your systems. For example, GKE provides software components that users can run on their own VM or in their own data center. Logs are generated from the user’s GKE instances and sent to a user’s Google Cloud project. GKE uses the logs or their metadata to provide user support.
User-written logs
These are written by custom applications and services. Typically, these logs are written to Cloud Logging by using the Ops Agent or the Logging agent, the Cloud Logging API, or the Cloud Logging client libraries.
Multi-cloud logs
Multi-cloud logs and Hybrid-cloud logs refer to logs from other cloud providers like Microsoft Azure and logs from on-premises infrastructure.
Security logs
Security logs help you answer “who did what, where, and when”. In this type, we can find two subtypes: Access Transparency logs and Audit logs (which contain four types).
Access Transparency logs provide you with logs of actions taken by Google staff when accessing your Google Cloud content. Access Transparency logs can help you track compliance with your legal and regulatory requirements for your organization.
Cloud Audit Logs provide information about administrative activities and accesses within your Google Cloud resources. Enabling audit logs helps your security, auditing, and compliance entities monitor Google Cloud data and systems for possible vulnerabilities or external data misuse. There are different types of audit logs: admin activity, data access, system event, and policy denied.
Admin Activity audit logs contain log entries for API calls or other actions that modify the configuration or metadata of resources. For example, these logs record when users create VM instances or change Identity and Access Management permissions. These logs are always written; you can’t configure, exclude, or disable them. Even if you disable the Cloud Logging API, Admin Activity audit logs are still generated.
Data Access audit logs contain API calls that read the configuration or metadata of resources, as well as user-driven API calls that create, modify, or read user-provided resource data. These logs — except for BigQuery Data Access audit logs — are disabled by default because can be quite large. If you want Data Access audit logs to be written for Google Cloud services other than BigQuery, you must explicitly enable them. Enabling the logs might result in your Google Cloud project being charged for the additional logs usage. For instructions on enabling and configuring Data Access audit logs, see Enable Data Access audit logs.
System Event audit logs contain log entries for Google Cloud actions that modify the configuration of resources. System Event audit logs are generated by Google systems; they aren’t driven by direct user action.
Policy Denied audit logs are recorded when a Google Cloud service denies access to a user or because of a security policy violation.
Big Picture
It could be quite confusing to understand what kinds of logs there are after reading all that. It may be clearer by looking at the diagram below.
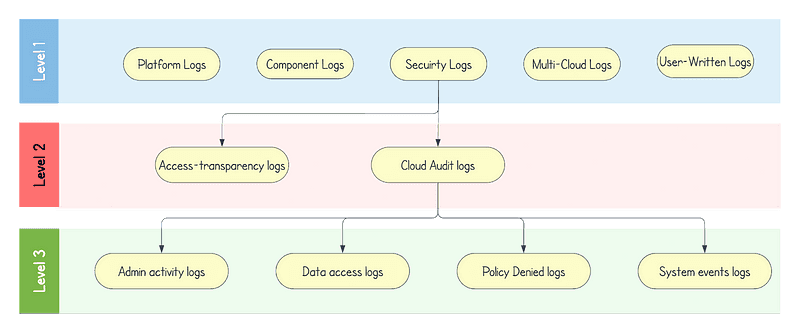
Types of logs
Where logs are stored
Cloud Logging uses log buckets as containers in your Google Cloud projects, billing accounts, folders, and organizations to store and organize your log data. These buckets are different storage entities than the similarly named Cloud Storage buckets. You can create log buckets by yourself, but Google Cloud creates two per project, billing account, folder, and organization to store them. These two are the _Required and _Default buckets.
These buckets can be linked directly to BigQuery at no extra cost. Using this feature, you will be able to perform queries into your logs directly and pay only for BigQuery compute consumed by your queries.
_Required log bucket
Cloud Logging automatically routes the following types of logs to the _Required bucket:
Google Workspace Admin Audit logs
Enterprise Groups Audit logs
Login Audit logs
Access Transparency logs
Cloud Logging retains the logs in the _Required bucket for 400 days; you can’t change this retention period. You can’t modify, delete, or disable the _Required bucket.
_Default log bucket
Any log entry that isn’t stored in the _Required bucket is routed by the _Default sink to the _Default bucket unless you disable or otherwise edit the _Default sink. However, the _Default bucket can’t be deleted.
For example, Cloud Logging automatically routes the following types of logs to the _Default bucket:
In the user interface, you can check the log buckets in the Logging -> Log storage section. We see an example below.
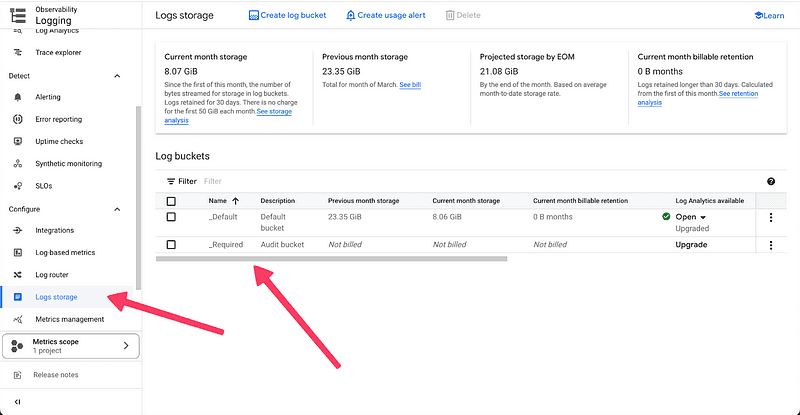
Log storage tab in Google Cloud
Default retention period for log buckets
By default, the logs from both buckets are retained for a default period, which cannot be changed for the _Required bucket. We will see in the pricing section how that affects how much we spend on logging.
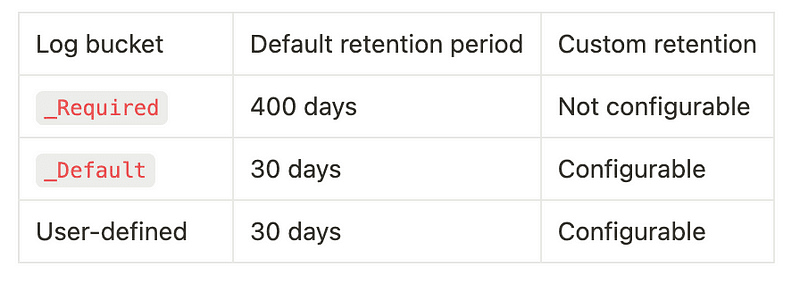
Google Cloud Logging default retention period
How to route logs to a different storage option
Logs are stored by default in log buckets. You create a log sink whenever you want to route logs to a specific destination. By default, two log sinks are created. They are linked with the log buckets previously explained (_Default and _Required). Check the sinks in the illustration below.
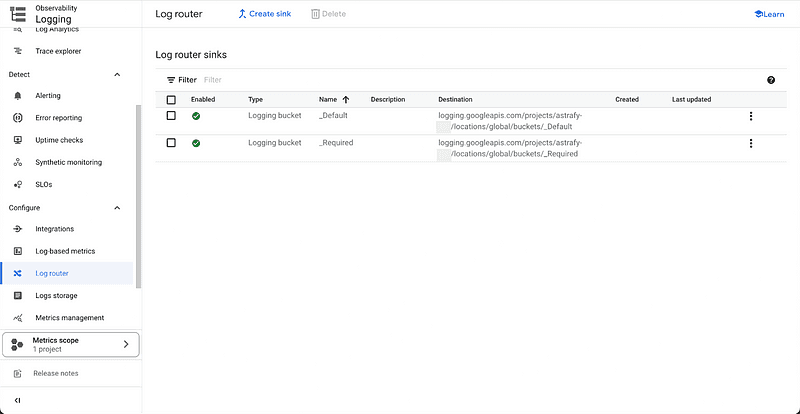
Google Cloud Log Router tab
When you create a sink, you can decide which logs you route into the selected location by adding a filter. You can also select where you want to route the logs. It can be directed to a log bucket, BigQuery dataset, PubSub topic, and many more. Below are the filters for the pre-defined sinks.
Filter of the _Required sink:
Filter of the _Default sink:
We can appreciate that they are completely disjoint. There is no overlap of logs being stored in both buckets. As we have said before, you can modify the _Default filter, but not the _Required filter.
How to access and review the logs
To check our logs, we have two built-in options in Google Cloud. These are the log explorer and the log analytics. You can potentially analyze the logs differently if you create your custom logic such as querying BigQuery datasets, analyzing logs on a cloud function through a PubSub topic, or any other logic.
Logs explorer
On this service, you can filter what logs to search by timeframe, severity, and scope. It is the most common way to explore looking for a specific case such as a bug or attempts to impersonalize a service account (keep in mind that data access logs need to be activated for each service except Bigquery). As in the Google Cloud documentation, it is divided into segments that allow you to personalize your query.
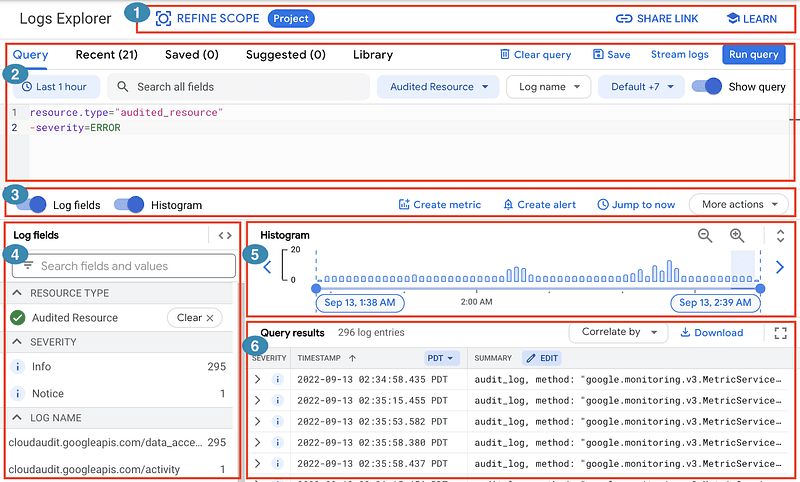
Log Explorer in Google Cloud
Log Analytics
This is a newer service offered in Google Cloud Logging. It allows you to query logs in a BigQuery-like fashion using SQL. The best part about using log analytics is its pricing. You can use it at no cost. This enables you to perform ad-hoc analysis over big quantities of log data without incurring in costs for your organization.
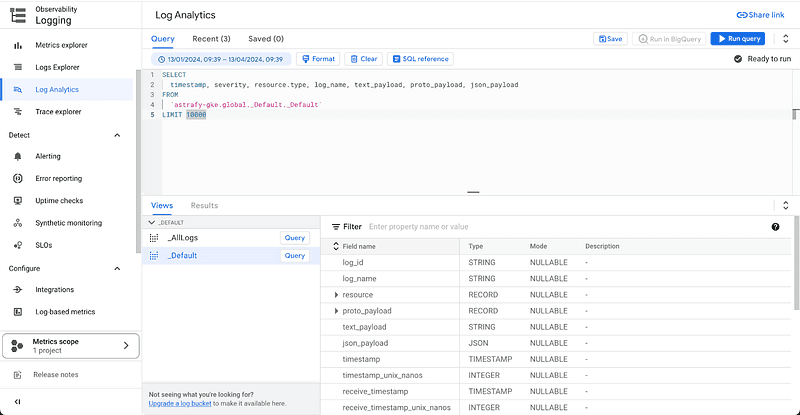
Log analytics in Google Cloud
Cloud Logging pricing
The pricing explanation from the official documentation can be misleading since they use two similar terms referring to different actions that can incur costs, which are logging storage and logging retention.
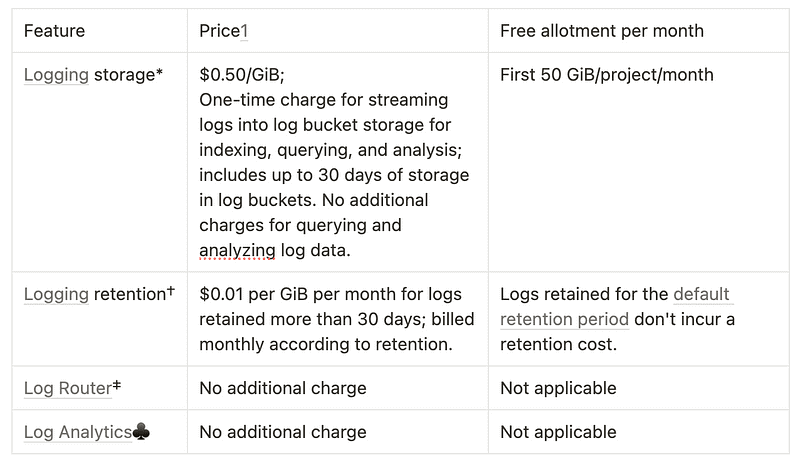
Google Cloud Logging pricing summary
Starting with the free services, you can create as many sinks as you want (log route) at no cost. However, you will need to pay for storage and retention, which makes it not to be free at all. Luckily, all the analysis using log analysis and log explorer is out of cost without small print.
Logging storage refers to the process of saving the logs into log buckets for storage. It is important to repeat that it only counts logs stored in the log bucket. If you create a sink to BigQuery, this cost does not apply and therefore it makes other storage solutions appealing. Keep in mind that to use Log Explorer and Log Analysis the logs need to be stored in a log bucket, so using another storing option is not convenient in many cases even if the cost is cheaper.
Logging retention is a cost incurred monthly by logs stored. In this case, is 0.01$ per GiB per month for logs stored for more than 30 days.
Pricing comparison
Let’s imagine a scenario in which you need to analyze your log data for compliance reasons. You want to use BigQuery to perform this analysis. Here you have two options:
create a link from your log bucket into BigQuery
route directly your logs into BigQuery.
Let’s explore the cost comparison of these two.
In the BigQuery linked dataset, you will pay for log storage, which is 0.50$ per GiB. If we only retain the logs for 30 days, these are free of charge, so let’s assume that for this scenario. No more costs are incurred except for the query cost, which is also included in the other option and therefore we will not take them into account.
If you sink the cost directly to BigQuery, you will incur BigQuery streaming cost which is around 0.05$ per GiB. BigQuery storage for one month (because we set a retention of 30 days) is around 0.02$ per GiB.
Therefore, by routing the logs to BigQuery we simply spend 0.07$ while, on the other hand, storing them on a log bucket costs us 0.50$ per GiB.
Pricing conclusion
It is normally advisable to store logs in log buckets so that you can perform ad hoc analysis on the log explorer for debugging purposes. Then, what would be the best way to perform BigQuery analysis on our logs and spend the least? Well, it depends on the scope you want to perform the analysis on.
At project level, logs are already stored in log buckets, and, likely, you don’t want to remove the _Default sink. Therefore, creating a linked dataset is the most economical option. If you want to route the logs for all your organization, that is not performed automatically by Google Cloud and therefore you need to create a new sink. In this case, using BigQuery as the destination of the sink is the most recommended method.
Thank you
We will keep writing on Cloud Logging and different use cases that can be performed with logs. Follow Astrafy on LinkedIn to be notified of the next article.
If you are looking for support on your Google Cloud data & ML use cases, feel free to reach out to us at sales@astrafy.io.